Agile Metrics
I've been meaning to write a blog post all about metrics for a very long... It's a really important subject and one that doesn't get spoken about anywhere near enough - I also plan to come back and add to this as time allows.
Metrics in Kanban as opposed to Scrum is perhaps more common place, Kanban is much more a case of bench marking where we are, Conducting 'experiments' and measuring the result before rolling back or continuing.
But good metrics not only allow you to understand the effects of experiments but also allow you to start planning with at least something approaching a scientific methodology! Although admittedly it does take more effort than the old finger in the air, double it + a safety margin trick that!
Below are some of the main metrics I use regularly.
Flow efficiency
I love this little metric - It gives a quick indication as to how efficient your process is.
The exact way you record it might differ based on what you're trying to measure... but roughly, Record the date a story is requested, record the date it's released and record the number of days it was actually worked on.
So if a story takes 20days from being moved from the backlog to the todo column and is worked on (developed/tested/etc) for 5 days you have a flow efficiency of 5/20= 25% Which although looking low is probably a really good figure!
Cumulative flow diagrams
CFD Diagram - Source, That’s Intelligence
I love a good CFD... It's a really good visual way to track a project. Most software tools will allow you to generate a Cumulative Flow Diagram - Otherwise you can export the data to Excel and generate one.
Generally speaking the closer together the lines the lower the WIP (Work In Progress) and shorter the lead times should be and the more work should get done (green)
You can see from the graph a very flat section early on where no work was getting done - That was before I joined as Scrum Master ;-) And another slight decrease in work 'done' and a longer lead time about 3/4 along... That could be a cause for concern.. It was actually the Christmas/New Year period but it shows graphically how well a team is working and how much work is left - These are great to take into retrospectives.
Lead Times
Lead times.... Are simple, How long from requesting a story (Moving from the backlog to todo) until release (or 'Done')
However you probably want to start recording lead times by story/ticket type.....
If your using story points starting plotting lead-times against story points using a histogram.
You start to get some really useful information back,
For example - You might be able to say that 85% of stories estimated at 13SP are delivered in under 5 days but up to 5% take longer than 10days.. However 50% are delivered in 3 days or less.
Having powerful metrics like this allows you to really plan... You can pick the right time to start doing work and know with a level of confidence when it will be complete.
You can prioritise stories more precisely - Knowing you can leave that really important legal change story until 10days before it's required as it's estimated at 13SP story which than means you can work on the 20SP story first as it'll save X-thousands every day!
Cycle Times
Cycle times are very common in Kanban and Scrumban...
It's a measure of the number of tickets in progress and the number of tickets completed daily - You can sample at different rates but I tend to run Scrumban in weekly cycles but different teams will work differently.
So... To keep the numbers simple, If you have 10 tickets in progress and complete 2 a day (average) - You cycle time is 5. 10/2
You should find if WIP increases so will the cycle time and the opposite too!
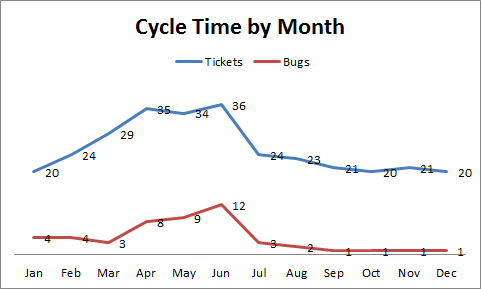
Start plotting cycle times and you'll begin to see trends... And trends are how you know it you're improving... or not! It's also useful to start plotting different types of tickets together - So below we can see that the cycle tine in May/June increased from the norm... But so were the cycle-times for bugs... You can't draw a conclusion from this but you can ask questions and understand.
Happiness/Satisfaction
This probably gets overlooked more than any other measurement. But measuring the happiness of your team and customers is probably one of the most important... Reality is important but perception probably more so!
This can be especially important if running an agile transformation... Bench mark how happy the team is! Understand your customers issues/concerns and overall level of happiness with the service.

You could create a mood wall, questionnaires, etc. The The mood wall in particular are really good for discussing in retrospectives.
Velocity!
Well I couldn't write a blog covering metrics without mentioning it... But I don't really want to discuss it too much on this blog, Velocity is fine for an internal team metric and helping to predict burn-down against a backlog or for allowing meaningful negotiation about story sequencing, etc.. But don't get carried away with it.. Try not to chase it and don't let people abuse it!
And if you do want to know more..... Velocity
Burn down
The burn-down chart - These are very common in Scrum, both for tracking progress in a sprint and for measuring against the backlog.
I must admit... I'm not really a great fan of the Sprint Burn-down - It seems to have become another chart that management overuse (Like velocity).
You should be able to track progress of stories completed via the Kanban/Task board. If you are doing a sprint burn-down - Perhaps rather than looking at hours against tasks and burning down perhaps looks at the number of stories in the sprint and burn down against that measurement - It's actually recording what's important (Completed stories)
I do however like a burn-down against a backlog (Although if you're using the CFD - this is less important) If you do have a well estimated well 'refined' backlog and you have a stable velocity figure these can be useful to either predict delivery or to alert early on that you're going to miss a release point.
In Conclusion
Metrics are important... They allow you to safely change the workings of a team and understand the effect. Management typically prefer's this way of working, it's safer and you have evidence to back up decision making.
At the planning level metrics are invaluable - And allow you to plan with some confidence.... Although planning when you have actual metrics suddenly becomes a much more complex and tiring process than just guessing it!
But you have to them use metrics responsibly and remember Goodhart's law -
“When a measure becomes a target, it ceases to be a good measure.”
Try and keep away from absolute numbers and monitor trends instead - The CFD's are brilliant for this - Look at the general trend not specific numbers. Don't chase a number but try and understand why those numbers are changing.